Editorials
Bernard-Louis Roques

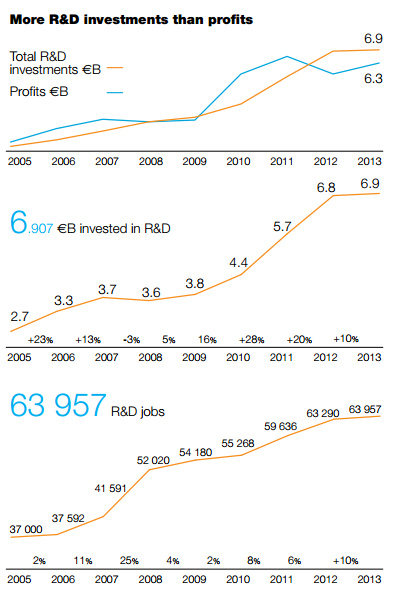
It has finally happened: the 9th edition of the Truffle 100 has a graph where the lines representing profits (6.3bn€) and research & development (6.9bn€) have crossed!
The software industry is currently going through a phase where investments are higher than revenues. Can this situation last? Companies are not governments. How long can they live with deficits, at a time when growth rates are decreasing drastically (+2% last year), and the industry is going through dramatic changes and paradigm shifts?
In the software business, there is no other choice than to invest in the future, particularly now at the eve of the ineluctable transition towards Saas and mobile. Software vendors are by nature resolute optimists always committed to building the product of the future, determined to bring productivity and efficiency to the economy, and open new possibilities and experiences to consumers.
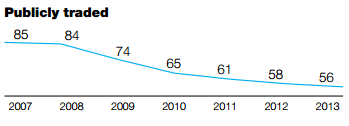
It is the first time since 2006, when the Truffle 100 was first published, that European Software vendors are in such a high-risk situation: while they need more resources than they generate through their activity, their access to capital markets has significantly reduced. European stock markets have indeed shown a lack of appetite for technology companies in comparison with their US counterparts, and are not fueling the industry as they used to (only 55 quoted companies today compared to 85 in 2007).
More than ever, with rising global competition, radical paradigm shifts in business models & technology (Saas & mobile), and price pressures, the European Software Industry deserves attention. Their call for the implementation of measures such as the Small Business Act (which has a positive budget impact and costs nothing to the governments), R&D tax breaks, or incentives for Venture Capital should not remain unheard..
General Partner & co-Founder, Truffle Capital
Bo Lykkegaard

The European software industry is currently undergoing a massive transition. Consumer driven trends, such as smart phones and tablets, social networks, predictive analytics, and cloud computing, are affecting every corner of packaged software. The consumer trends have significantly raised the expectations of business software users. These business users are consumers in their private life, searching on Google, connecting on Facebook, and purchasing on Amazon. They are not willing to accept old-fashioned, transactional, menu-driven, PC-based applications, which do not work on mobile devices or via the web. Those ISVs that are slow to adapt to the new consumer trends are experiencing declining revenues and falling profit margins, while innovators are reaping gains in market share and scale. In short, the European software vendors are under considerable pressure. .
The technology-driven transition has many opportunities as well. The new developments will expand the overall software market size rather than collapse it and new market opportunities are emerging. The opportunities include new markets such as digital marketing applications, enterprise social networks, and file-sharing software. Other opportunities emerge from adoption of cloud software by segments that traditional software vendors found it hard to sell to, such as micro enterprises. We have seen European cloud natives enjoy very high growth rates. Traditional vendors that have launched new, cloud-based solutions have been able to create new pockets of high growth.
For the European region, the technology transition requires the formation of new IT skills related to cloud and consumerrelated technologies. It also requires better mobile and fixed-line broadband infrastructure to fuel the adoption of the new mobile and cloud-based software models. Such investments will be key contributors for European ISVs to exploit new wave of innovation in enterprise software on the back of the consumer IT revolution.
Research Director, European Enterprise Applications, IDC
Laurent Calot

Companies of the future will be able to develop their strategies based in an entirely digital domain. With this in mind, our customers have initiated their transformation process. Their information systems will be re-focused on data: an organisation's value, positioning within worldwide economy and business orientation will thus be solely built on its informational assets. To this end, information systems must be supported by software solutions that integrate new digital technologies. These technologies come in the form of Software as a Service (SaaS), mobile applications, digitisation, analytics and Big Data, social affairs and collective intelligence and the Internet of Things for instance, not forgetting the entire system's cornerstone: the Cloud.
With a view to facing this extraordinary challenge, the software industry is learning to adapt. The European Truffle listing is proof of this: barriers are gradually being broken down between developers, integrators and IT service providers. Traditional major software industry stakeholders are having to face new-born competition, positioned within the cloud's many possible by-products and connected offering and mobile services that enhance an increasingly "hybrid" information system, thus unveiling promising perspectives
The world of software and digital technologies is, now, more than ever before, upending companies' usual points of reference, ways of working, producing and marketing, and their relations with employees, customers and the market as a whole. It is now safe to say we have entered the digital age
CEO, CXP Group
Figures
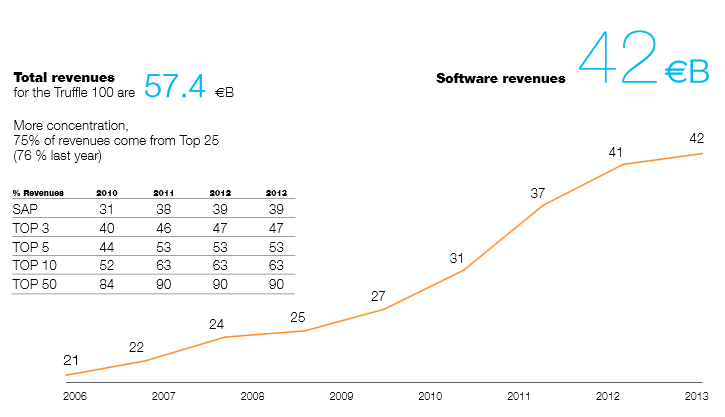
Total revenues for the Truffle 100 are 57.4 €B
More concentration, 75% of revenues come from Top 25(76 % last year)
| % Revenues | 2010 | 2011 | 2012 | 2013 |
|---|---|---|---|---|
|
SAP |
31 % | 38 % | 39 % | 39 % |
| TOP 3 | 40 % | 46 % | 47 % | 47 % |
| TOP 5 | 44 % | 53 % | 53 % | 53 % |
| TOP 10 | 52 % | 63 % | 63 % | 63 % |
| TOP 50 | 84 % | 90 % | 90 % | 90 % |
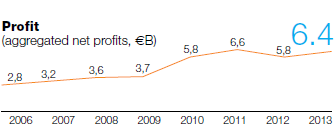
| Profits | |||||||
|---|---|---|---|---|---|---|---|
| 2008 | 2009 | 2010 | 2011 | 2012 | 2013 | % of revenues T 100 | |
| SAP | 51% | 46% | 31% | 52% | 48% | 52% | 39% |
| TOP 3 | 62% | 58% | 40% | 60% | 58% | 59% | 47% |
| TOP 5 | 67% | 66% | 44% | 66% | 65% | 67% | 53% |
| TOP 10 | 67% | 66% | 52% | 79% | 79% | 79% | 63% |
| TOP 50 | 92% | 91% | 84% | 96% | 95% | 97% | 90% |
The bigger, the more profitable
| Profitability | 2010 | % of revenues 2011 | 2012 | 2013 | Profits €M 2013 |
|---|---|---|---|---|---|
| TOP 3 | 15.2% | 22.9% | 17.0% | 18.5% | 3788 |
| TOP 25 | 12.0% | 12.9% | 5550 | ||
| TOP 50 | 12.2% | 13.5% | 10.8% | 12.1% | 6216 |
| BOTTOM 50 | 10.6% | 5.2% | 4.6% | 2.6% | 161 |
| BOTTOM 25 | 13.4% | 6.9% | 6.8% | 7.9% | 142 |
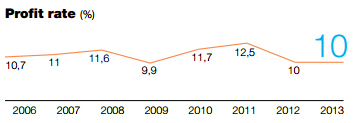
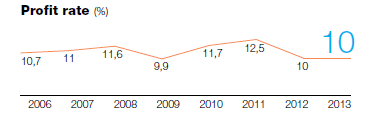
Profit rate
Publicly traded
Top 5 countries in Europe represent 86.4% of software revenues
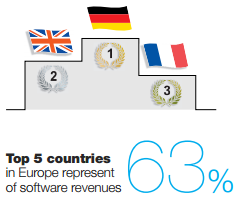
| Country | 2011 | 2012 | SW revenues (€M) 2013 | % of total | # SW companies |
|---|---|---|---|---|---|
| Germany | 18 145.7 | 20 328.6 | 21 046.4 | 49.9% | 15 |
| UK | 5 497.3 | 5 994.6 | 5 406.8 | 12.8% | 20 |
| France | 4 040.9 | 4 348.9 | 5 028.5 | 11.9% | 21 |
| Sweden | 2 163.5 | 2 326.5 | 2 392.0 | 5.7% | 9 |
| Netherlands | 2 187.9 | 2 236.2 | 2 103.7 | 5.0% | 6 |
| Poland | 1 005.5 | 1 152.4 | 1 229.1 | 2.9% | 2 |
| Switzerland | 1 110.8 | 1 208.2 | 1 174.6 | 2.8% | 5 |
| Finland | 618.1 | 625.0 | 656.6 | 1.6% | 6 |
| Norway | 486.2 | 544.8 | 639.2 | 1.5% | 3 |
| Italy | 516.5 | 557.3 | 625.8 | 1.5% | 3 |
| Belgium | 530.1 | 594.9 | 580.2 | 1.4% | 1 |
| Czech Republic | 248.5 | 361.9 | 375.9 | 0.9% | 2 |
| Denmark | 194.4 | 287.0 | 303.0 | 0.7% | 2 |
| Slovakia | 149.1 | 256.4 | 301.4 | 0.7% | 1 |
| Spain | 176.7 | 198.4 | 189.2 | 0.4% | 2 |
| Austria | 116.4 | 126.3 | 120.3 | 0.3% | 2 |
| TOTAL | 37 187.7 | 41 147.7 | 42 172.6 | 100.0% | 100 |
World-class national champions
| Vendor | Country | Revenues (€M) | % of Truffle 100 |
|---|---|---|---|
| SAP | DE | 16 512 | 39.2% |
| Dassault Systemes | FR | 1 888 | 4.5% |
| Sage | UK | 1 523 | 3.6% |
| Hexagon | SE | 1 310 | 3.1% |
| ASSECO GROUP | PL | 1 063 | 2.5% |
| SWIFT | BE | 580 | 1.4% |
| VISMA | NO | 485 | 1.2% |
Sustainable growth
Total revenues for the Truffle 100 are 57.4 €BMore concentration, 75% of revenues come from Top 25(76 % last year)
| % Revenues | 2010 | 2011 | 2012 | 2013 |
|---|---|---|---|---|
|
SAP |
31 % | 38 % | 39 % | 39 % |
| TOP 3 | 40 % | 46 % | 47 % | 47 % |
| TOP 5 | 44 % | 53 % | 53 % | 53 % |
| TOP 10 | 52 % | 63 % | 63 % | 63 % |
| TOP 50 | 84 % | 90 % | 90 % | 90 % |
Profitability under pressure
| Profits | |||||||
|---|---|---|---|---|---|---|---|
| 2008 | 2009 | 2010 | 2011 | 2012 | 2013 | % of revenues T 100 | |
| SAP | 51% | 46% | 31% | 52% | 48% | 52% | 39% |
| TOP 3 | 62% | 58% | 40% | 60% | 58% | 59% | 47% |
| TOP 5 | 67% | 66% | 44% | 66% | 65% | 67% | 53% |
| TOP 10 | 67% | 66% | 52% | 79% | 79% | 79% | 63% |
| TOP 50 | 92% | 91% | 84% | 96% | 95% | 97% | 90% |
The bigger, the more profitable
| Profitability | 2010 | % of revenues 2011 | 2012 | 2013 | Profits €M 2013 |
|---|---|---|---|---|---|
| TOP 3 | 15.2% | 22.9% | 17.0% | 18.5% | 3788 |
| TOP 25 | 12.0% | 12.9% | 5550 | ||
| TOP 50 | 12.2% | 13.5% | 10.8% | 12.1% | 6216 |
| BOTTOM 50 | 10.6% | 5.2% | 4.6% | 2.6% | 161 |
| BOTTOM 25 | 13.4% | 6.9% | 6.8% | 7.9% | 142 |
Profit rate
Publicly traded
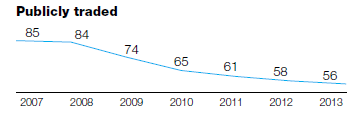
Capital markets loose attractiveness
| # | Software Revenues (€M) | % of Truffle 100 | R&D Spend (€M) | % of Truffle 100 €M) | Profits (€M) | % of Truffle 100 | |
|---|---|---|---|---|---|---|---|
| Publicly traded | 56 | 34 008.1 | 80.6% | 5 271.7 | 76.3% | 6 055.9 | 95.0% |
| Private | 44 | 8 164.5 | 19.4% | 1 635.2 | 23.7% | 320.8 | 5.0% |
| Total | 100 | 42 172.6 | 100% | 6 906.9 | 100% | 6 376.7 | 100% |
Top 5 countries in Europe represent 86.4% of software revenues
| Country | 2011 | 2012 | SW revenues (€M) 2013 | % of total | # SW companies |
|---|---|---|---|---|---|
| Germany | 18 145.7 | 20 328.6 | 21 046.4 | 49.9% | 15 |
| UK | 5 497.3 | 5 994.6 | 5 406.8 | 12.8% | 20 |
| France | 4 040.9 | 4 348.9 | 5 028.5 | 11.9% | 21 |
| Sweden | 2 163.5 | 2 326.5 | 2 392.0 | 5.7% | 9 |
| Netherlands | 2 187.9 | 2 236.2 | 2 103.7 | 5.0% | 6 |
| Poland | 1 005.5 | 1 152.4 | 1 229.1 | 2.9% | 2 |
| Switzerland | 1 110.8 | 1 208.2 | 1 174.6 | 2.8% | 5 |
| Finland | 618.1 | 625.0 | 656.6 | 1.6% | 6 |
| Norway | 486.2 | 544.8 | 639.2 | 1.5% | 3 |
| Italy | 516.5 | 557.3 | 625.8 | 1.5% | 3 |
| Belgium | 530.1 | 594.9 | 580.2 | 1.4% | 1 |
| Czech Republic | 248.5 | 361.9 | 375.9 | 0.9% | 2 |
| Denmark | 194.4 | 287.0 | 303.0 | 0.7% | 2 |
| Slovakia | 149.1 | 256.4 | 301.4 | 0.7% | 1 |
| Spain | 176.7 | 198.4 | 189.2 | 0.4% | 2 |
| Austria | 116.4 | 126.3 | 120.3 | 0.3% | 2 |
| TOTAL | 37 187.7 | 41 147.7 | 42 172.6 | 100.0% | 100 |
World-class national champions
| Vendor | Country | Revenues (€M) | % of Truffle 100 |
|---|---|---|---|
| SAP | DE | 16 512 | 39.2% |
| Dassault Systemes | FR | 1 888 | 4.5% |
| Sage | UK | 1 523 | 3.6% |
| Hexagon | SE | 1 310 | 3.1% |
| ASSECO GROUP | PL | 1 063 | 2.5% |
| SWIFT | BE | 580 | 1.4% |
| VISMA | NO | 485 | 1.2% |
Top 5 countries represent 84% of total R&D jobs
| Countries | Number of R&D employees | % of total | R&D investment (€M) | % of total |
|---|---|---|---|---|
| Germany | 23 085 | 37.7% | 2 889.0 | 41.80% |
| France | 11 409 | 17.8% | 1 088.8 | 15.8% |
| UK | 6 887 | 10.8% | 859.3 | 12.4% |
| Netherlands | 5 584 | 8.7% | 702 | 10.2% |
| Sweden | 4 849 | 7.6% | 457.5 | 6.6% |
| Switzerland | 1 027 | 1.6% | 148.5 | 2.2% |
| Poland | 3 905 | 6.1% | 122.9 | 1.8% |
| Norway | 797 | 1.2% | 111.5 | 1.6% |
| Finland | 1 157 | 1.8% | 107.3 | 1.6% |
| Italy | 1 677 | 2.6% | 96.8 | 1.4% |
| Czech Republic | 667 | 1.0% | 92.9 | 1.3% |
| Denmark | 638 | 1.0% | 74.7 | 1.1% |
| Belgium | 485 | 0.8% | 67.9 | 1.0% |
| Spain | 298 | 0.5% | 34.8 | 0.5% |
| Slovakia | 350 | 0.5% | 33.2 | 0.5% |
| Austria | 142 | 0.2% | 19.6 | 0.3% |
| Total | 63 957 | 100.% | 6 906.9 | 100.% |
Major M&A transaction
M&A highlight
2013
- Adobe acquired Neolane
- Advanced Computer Software Group acquired Computer Software Holdings
- Constellation Software acquired Total Specific Solutions
- IRIS Software acquired Kashflow
- Kewill acquired Four Soft
- Lefebvre Software acquired Cezanne Software
- Lefebvre Software changed name to Talentia
- OMERS Private Equity acquired Civica
- Opentext acquired Cordys
- R12 Kapital acquired Aditro from Nordic Capital Fund
- Sage divested Act! And SalesLogix
- SAP acquired Hybris
- SAP acquired KXEN
- Sopra acquired HR Access
- Symphony acquired Aldata Solution and merged it with EYC
2014
- Autodesk acquired Delcam
- Advent International acquired Unit4
- COR&FJA changed name to msg life AG
- Dassault Systemes acquired Accelrys
- Dassault Systemes acquired Quintiq
- Dassault Systemes acquired SimPack
- Hexagon acquired Devex
- Hexagon acquired iLab Sistemas
- Hexagon acquired Mintec
- Hexagon acquired North West Geomatics
- Hexagon acquired Vero Software
- Misys acquired Custom Credit Systems
- Misys acquired IND Group
- Lexmark acquired ReadSoft
- Sage acquired PayChoice
- SAP acquired Concur
- SAP acquired Fieldglass
- SAP acquired SeeWhy
- Schneider Electric acquired Invensys
- Software AG acquired JackBe
- Software AG sells off IDS Scheer Consulting to The Scheer Group
- Sopra Group acquired the COR&FJA Banking Solutions
- Wincor Nixdorf acquired Datec Retail Systems